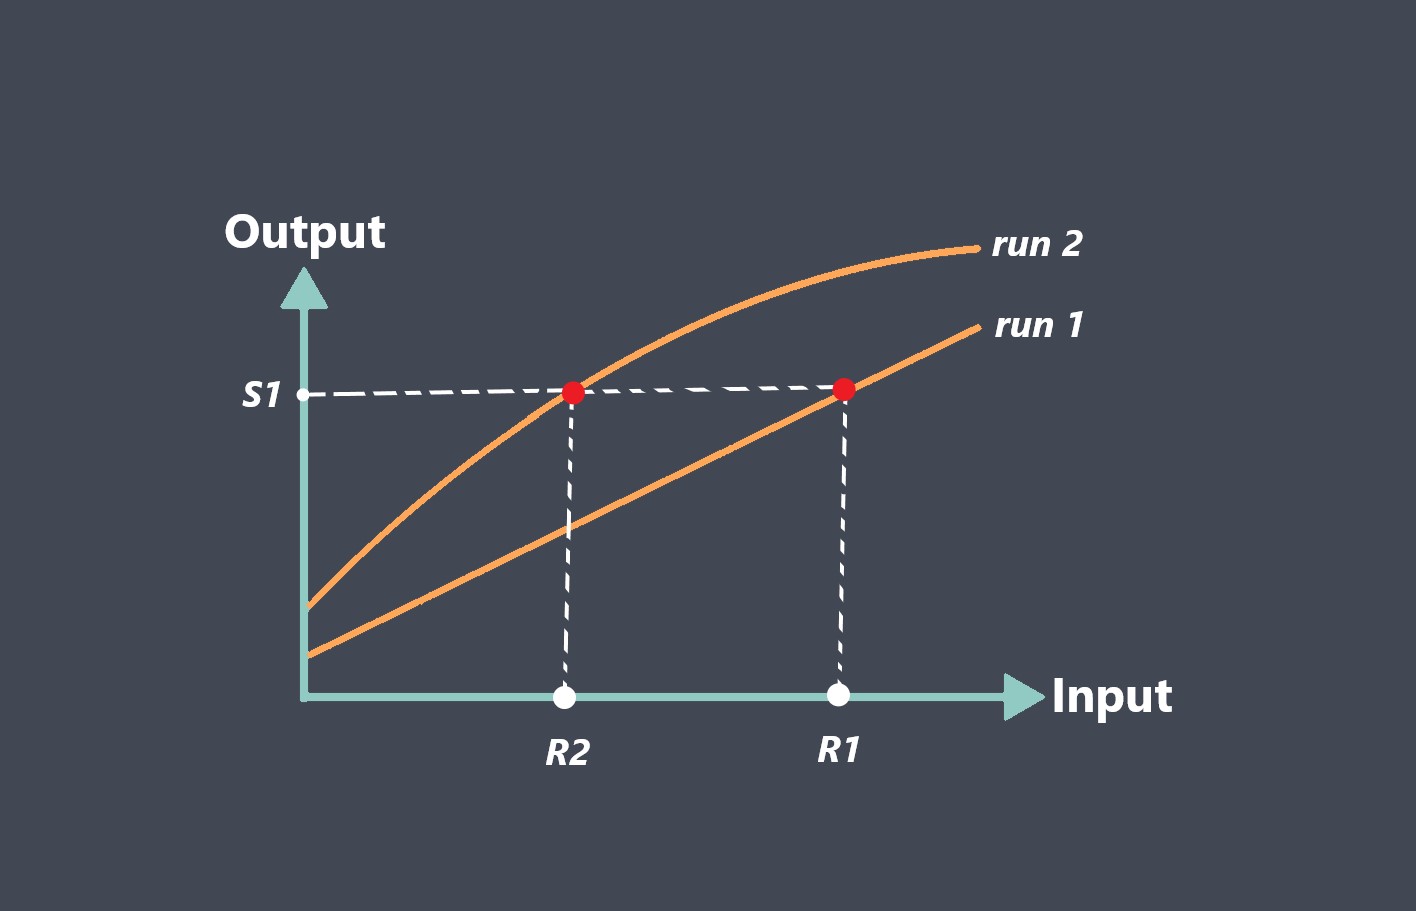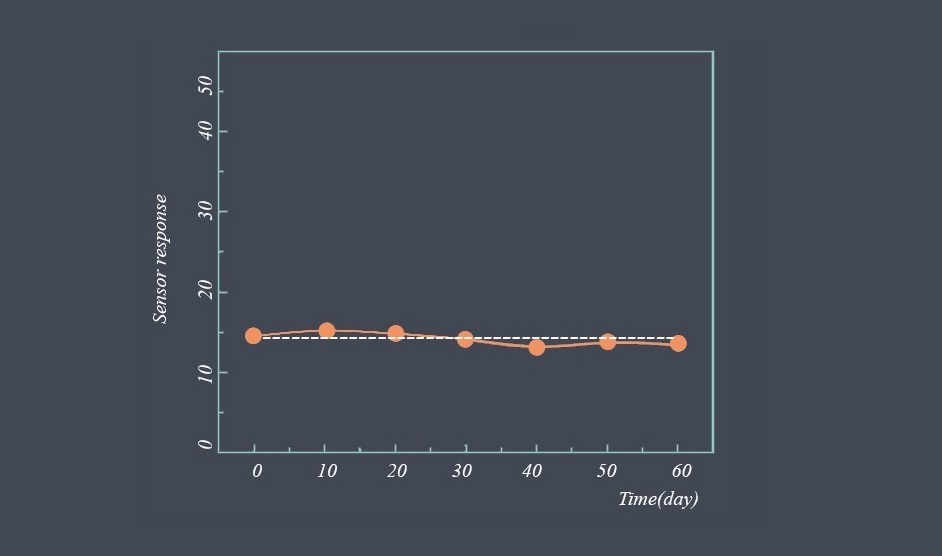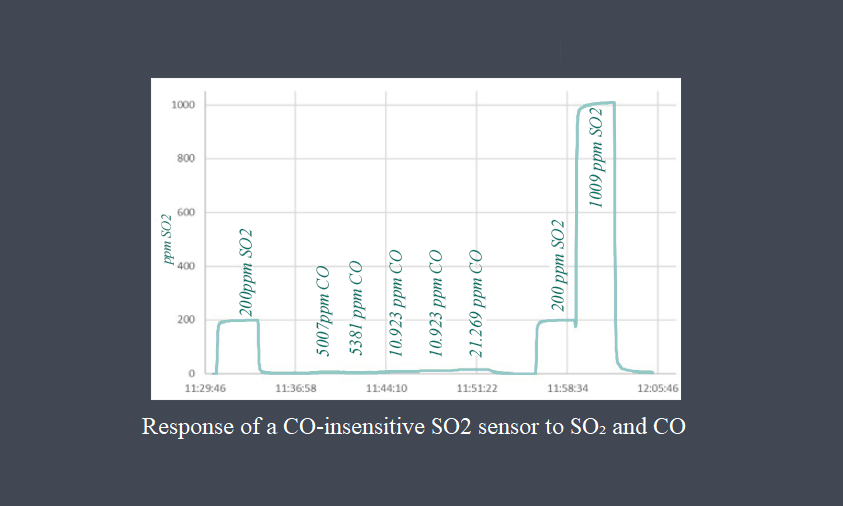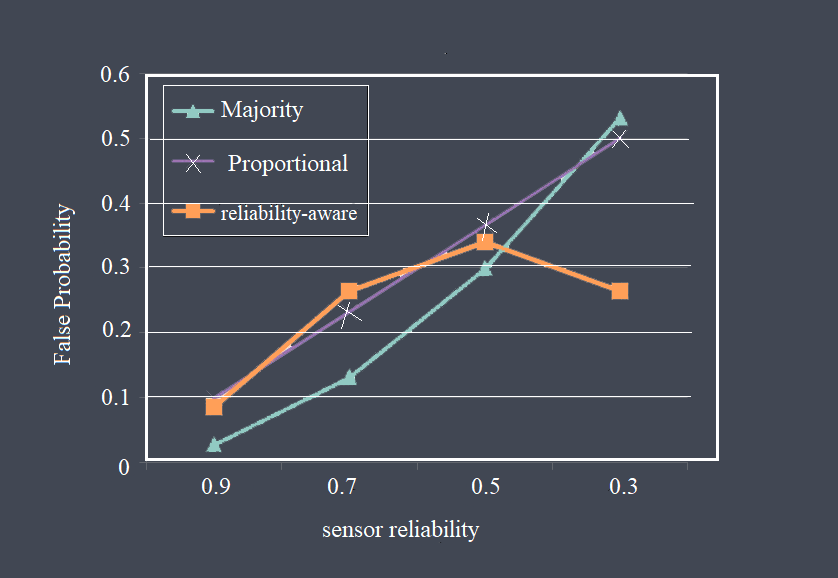
The response curve is a graphical representation that shows the relationship between the input signal and the output signal of a sensor. It illustrates how the sensor’s output changes with different input signal levels. The response curve provides valuable information about the sensor’s behavior, including its sensitivity, linearity, and saturation limits.
A sensor response curve, also known as an input-output curve or transfer function, describes the relationship between the input signal applied to a sensor and the corresponding output response of the sensor. It provides information about how the sensor converts physical quantities into measurable electrical signals.
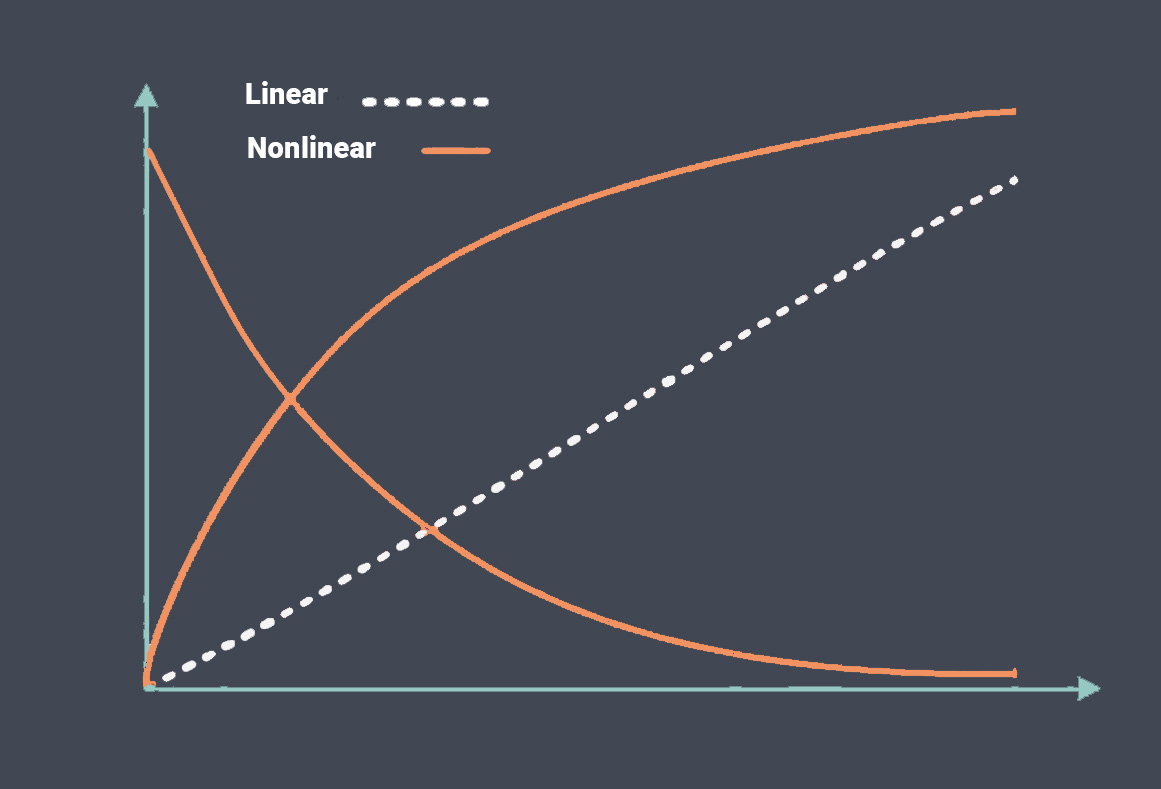
The shape of a sensor response curve depends on the specific type of sensor and the physical phenomenon it is designed to measure. It can be linear, indicating a direct and proportional relationship between the input and output signals. Alternatively, it can be non-linear, exhibiting a more complex relationship. However, many sensors exhibit similar characteristics in their response curves. Here are a few common types of sensor response curves:
Linear Response Curve
In a linear response curve, the output of the sensor is directly proportional to the input signal. For example, if the input doubles, the output also doubles. This type of response is desirable in many applications as it simplifies the calibration and interpretation of sensor measurements.

Nonlinear Response Curve
Nonlinear response curves are more common in sensors as they often exhibit a non-proportional relationship between the input and output.
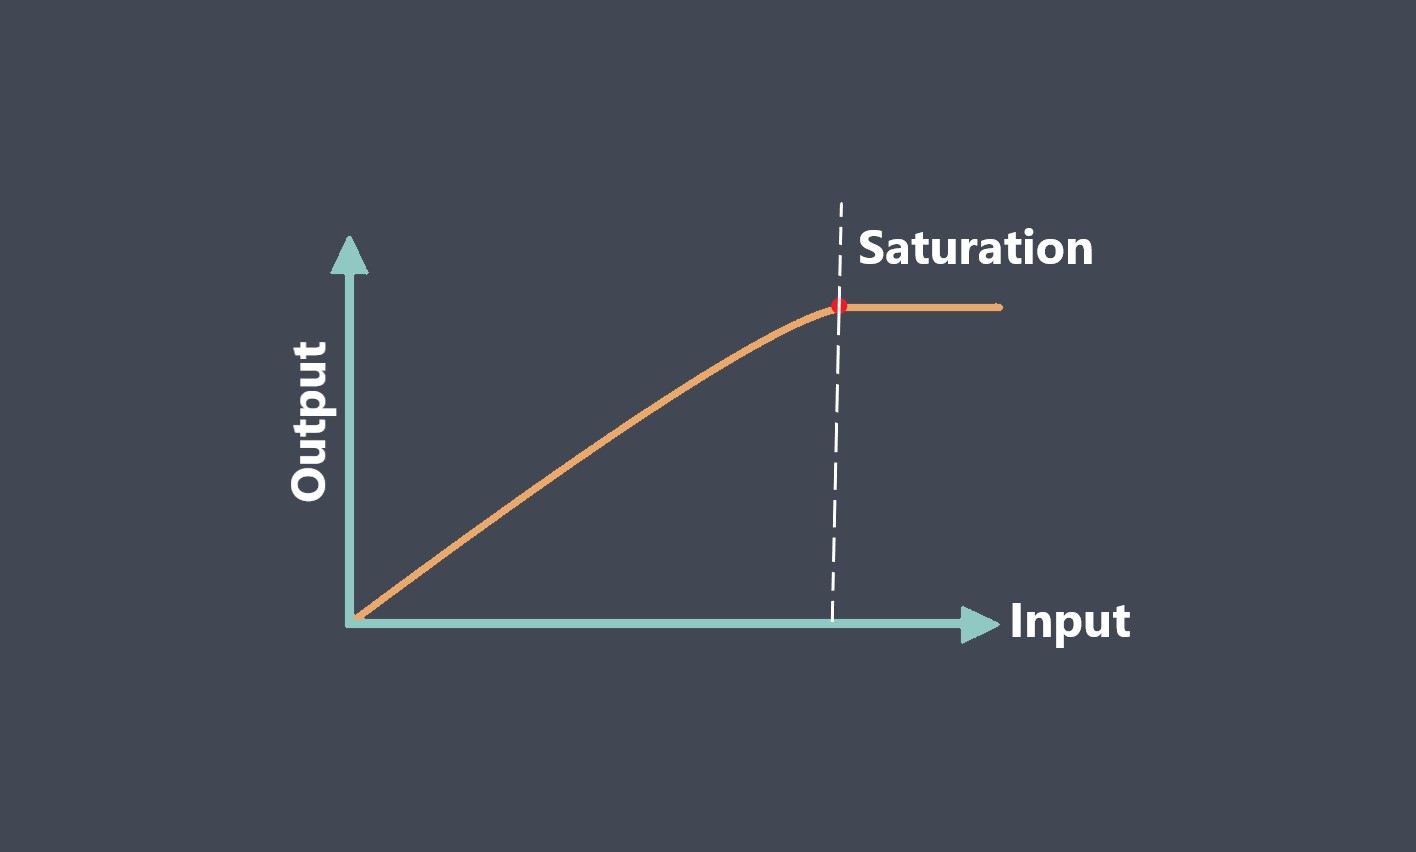
Nonlinear response curves can take various forms, such as exponential, logarithmic, or polynomial functions. These curves are often characterized by

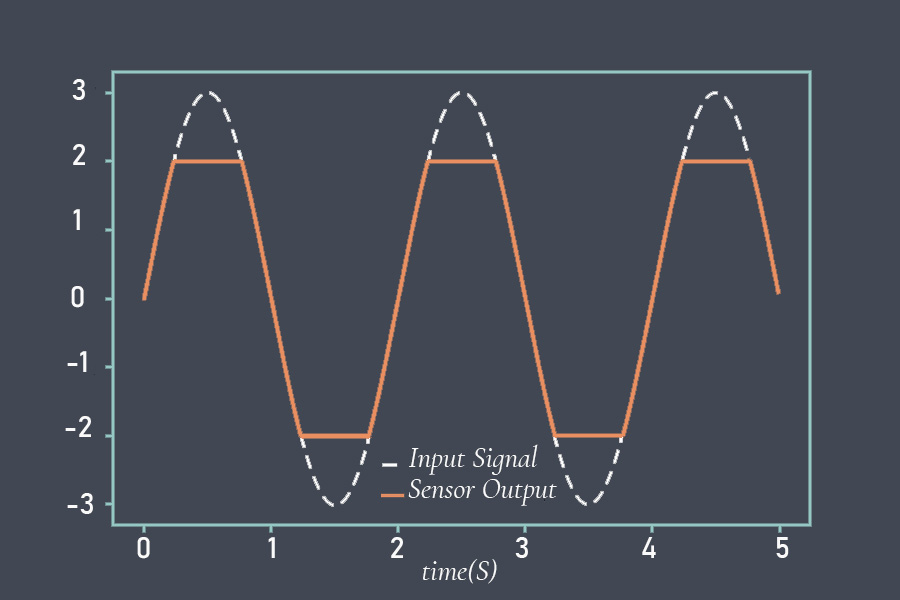
a saturation region where further increases in the input signal produce diminishing changes in the output.
Threshold Response Curve
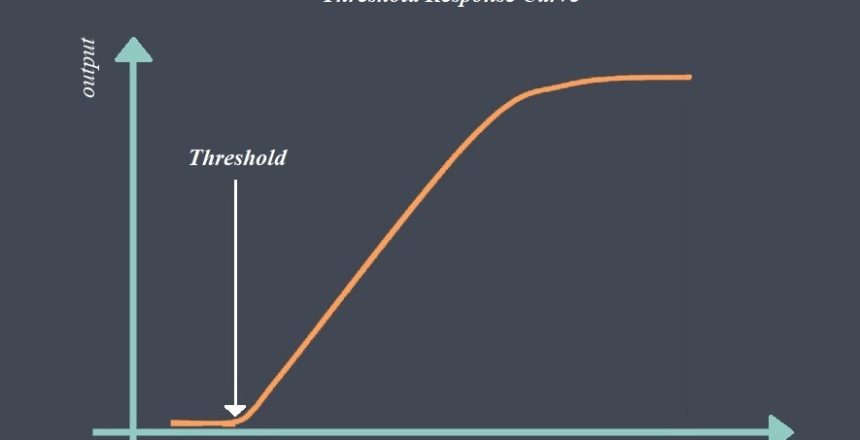
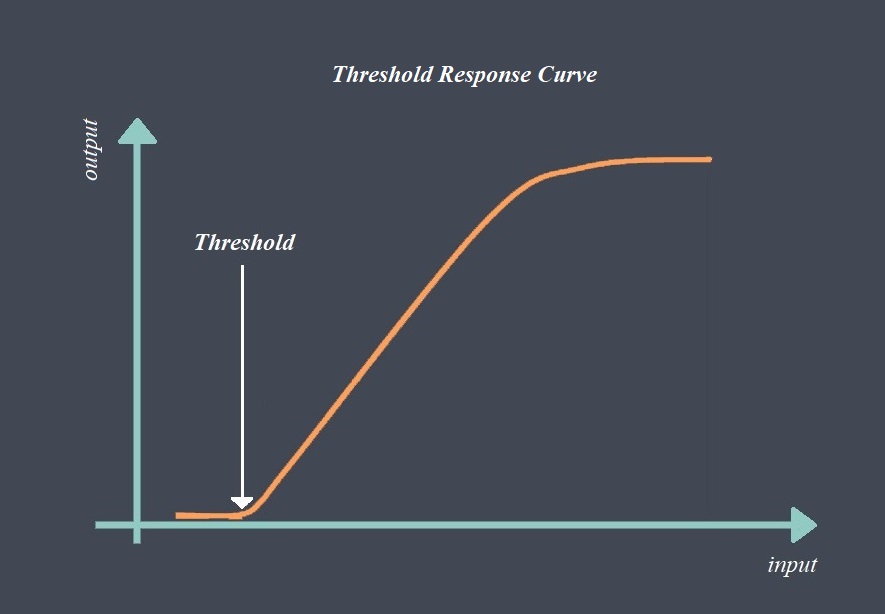
Some sensors have a threshold response curve, where the sensor output remains constant until the input signal exceeds a certain threshold value. Once the threshold is reached, the output response increases rapidly.

This type of response is often observed in binary or digital sensors that detect the presence or absence of a particular condition.
Sigmoid Response Curve
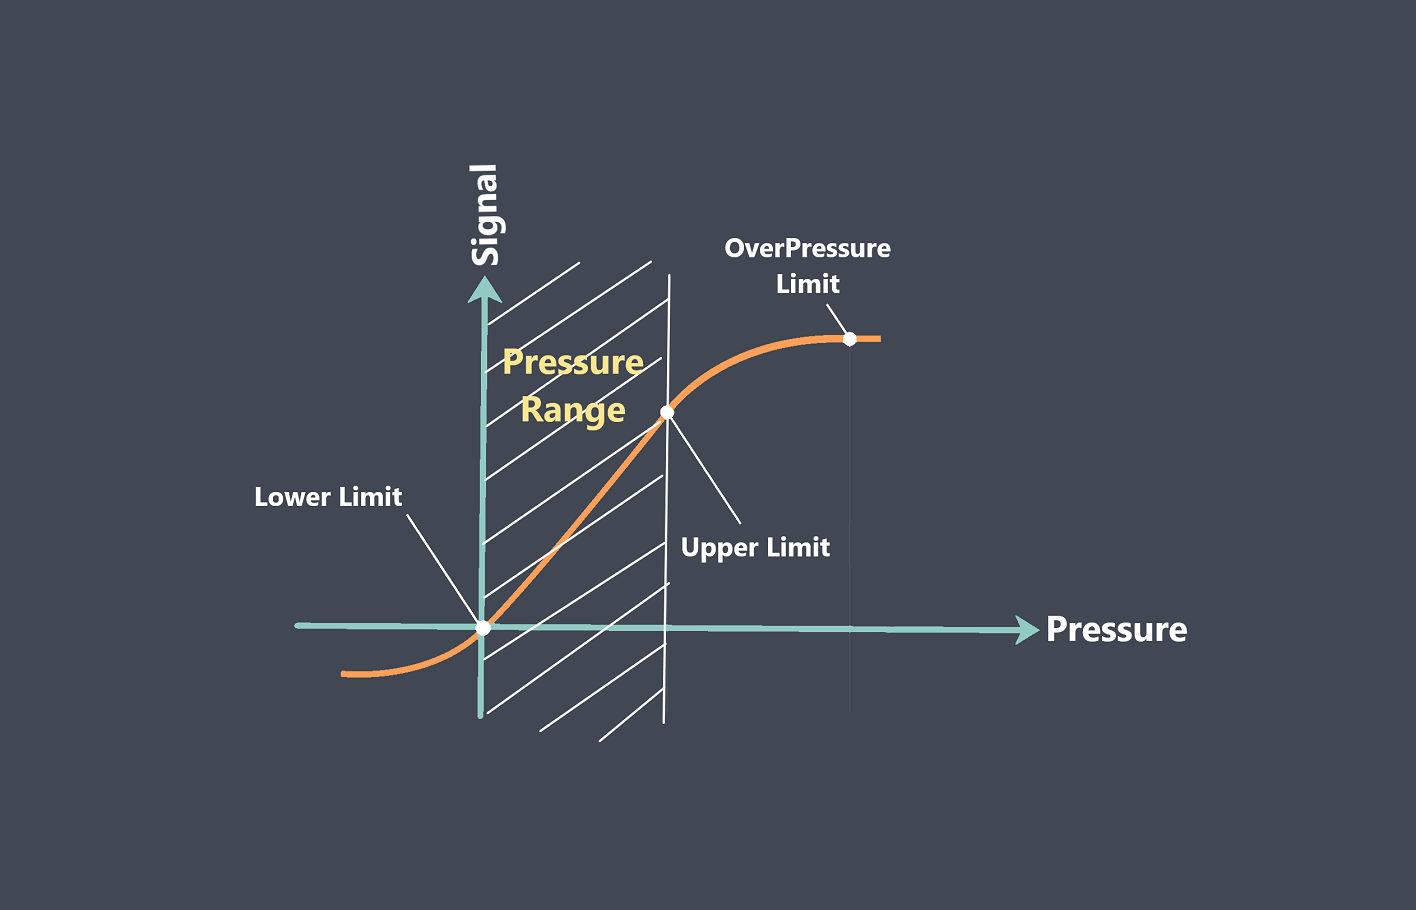
A sigmoid response curve exhibits an “S” shape, resembling an Sigmoid function. The output response starts slowly, then increases rapidly around a certain point, and eventually levels off. This type of curve is often found in sensors that exhibit a gradual response at low input levels and a more pronounced response at higher input levels.

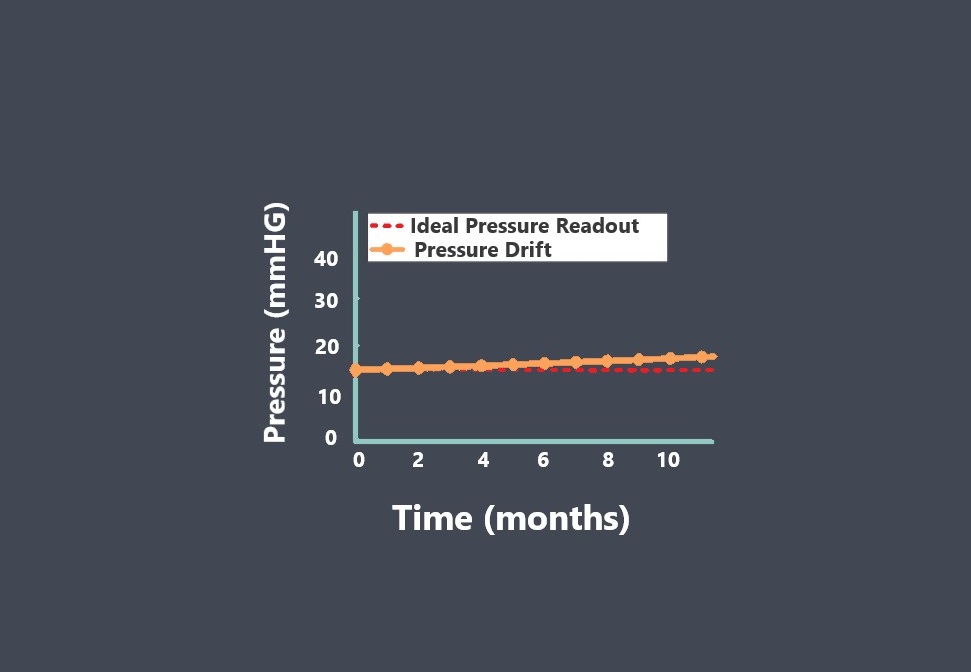
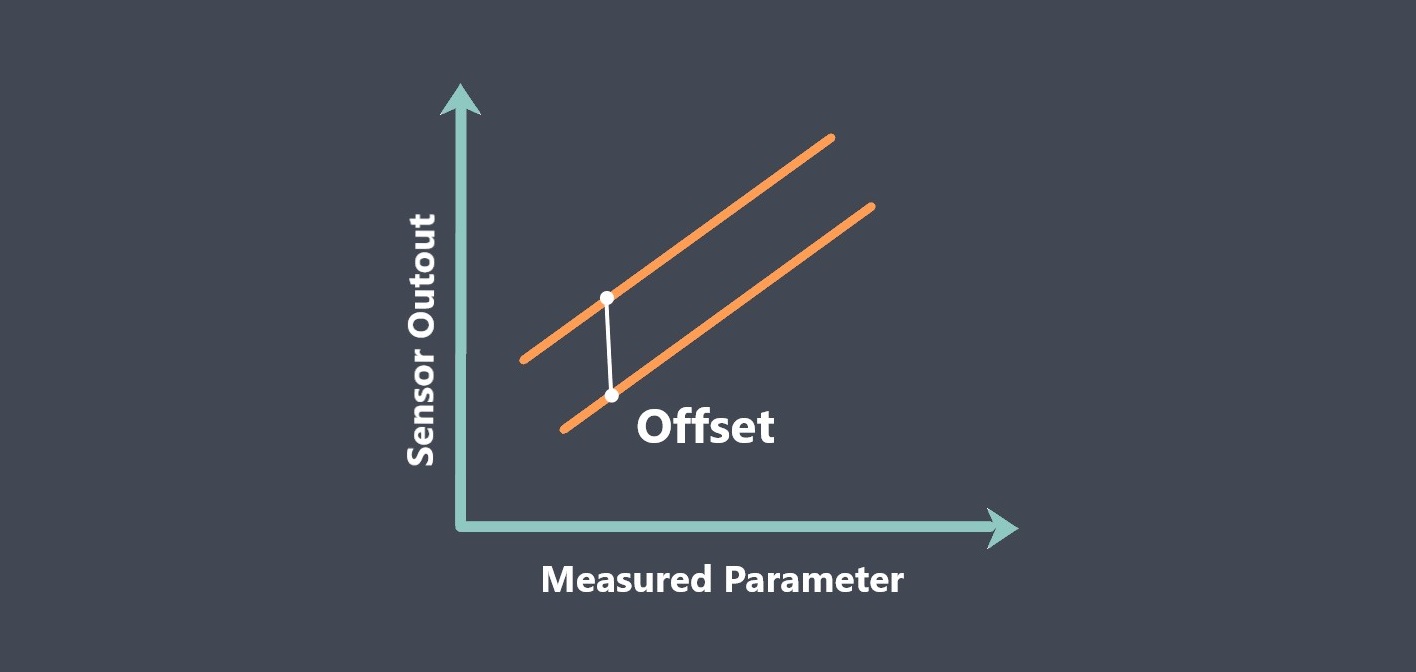
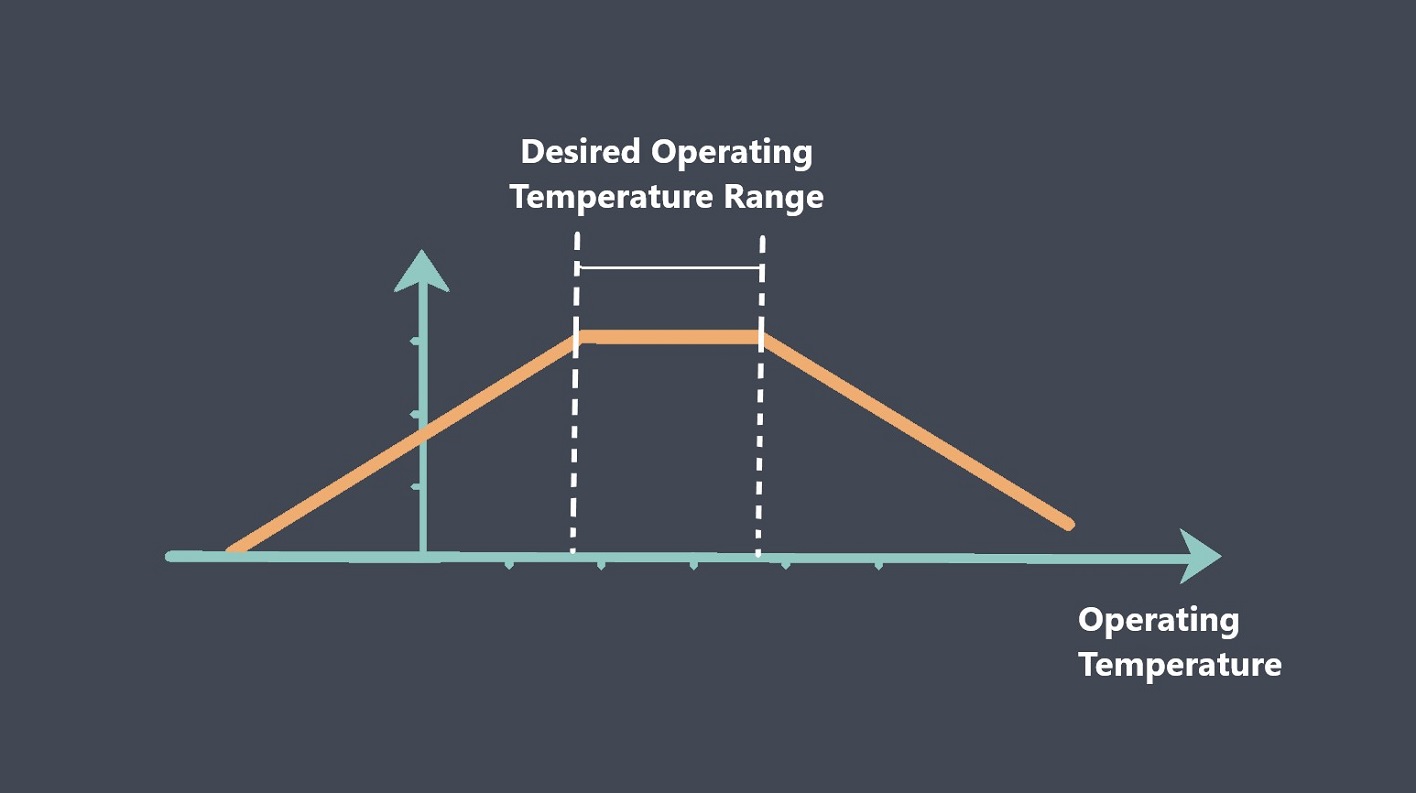
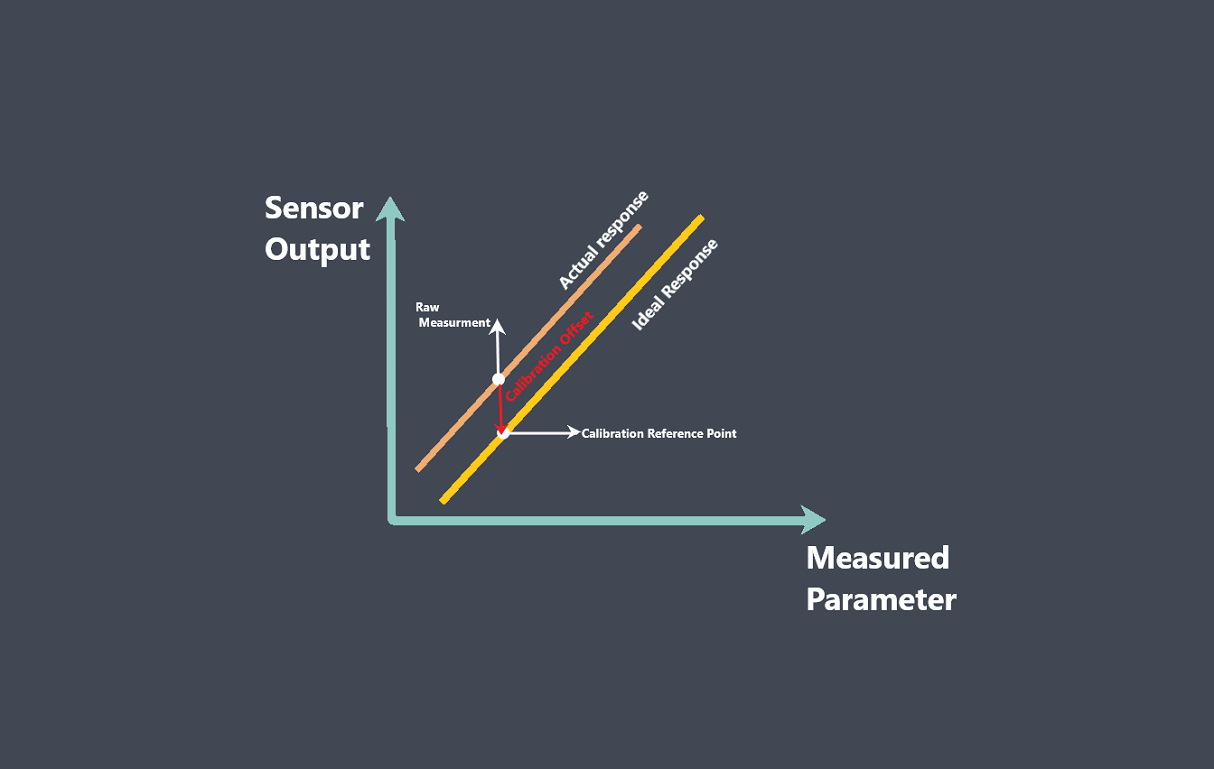
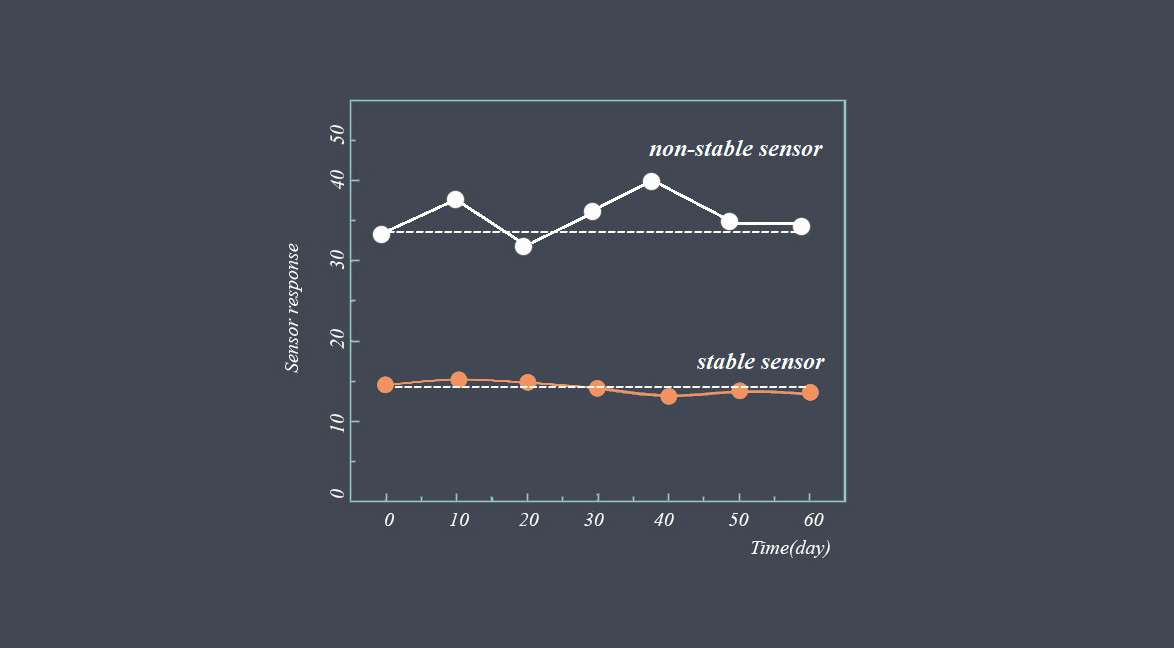
The sensor response curve can be influenced by various factors, including temperature, calibration, linearity, hysteresis, and environmental conditions. Manufacturers typically provide specifications and calibration data to characterize the response curve of sensors and ensure accurate measurements.
Importance of analyzing the sensor response curve
Analyzing the response curve of a sensor can provide valuable information about several characteristics of the sensor. Here are some of the characteristics that can be determined or inferred from the response curve:
Sensitivity
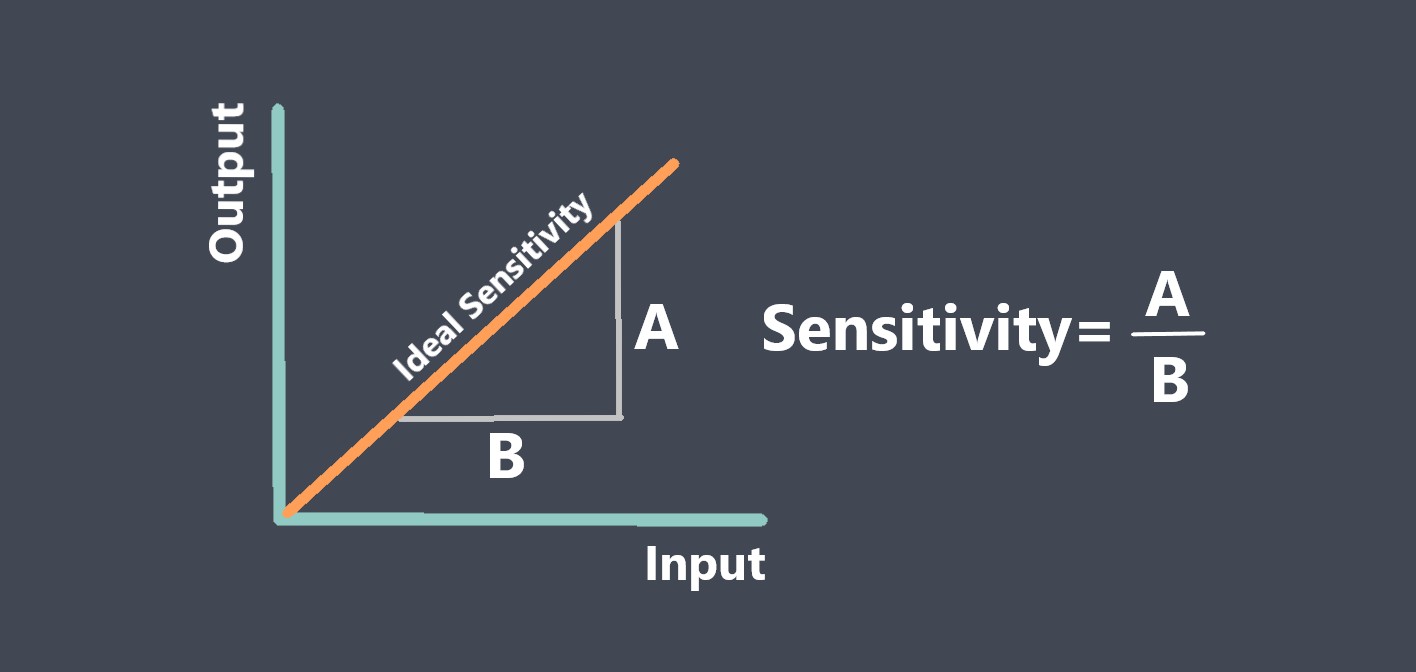
The slope or steepness of the response curve at a specific point indicates the sensor’s sensitivity. A steeper slope suggests higher sensitivity, meaning that small changes in the input signal result in larger changes in the sensor’s output. On the other hand, a flatter slope indicates lower sensitivity.
Dynamic Range
The response curve provides insights into the dynamic range of the sensor. By examining the range of input values over which the sensor’s response is linear or within acceptable measurement accuracy, you can determine the upper and lower bounds of the sensor’s dynamic range. Saturation regions on the response curve indicate the maximum measurable input signal beyond which the sensor’s output no longer increases linearly.
Linearity
The linearity of the sensor’s response can be assessed by examining how closely the response curve follows a straight line. A perfectly linear sensor would have a response curve that is a straight line passing through the origin. Any deviations from linearity indicate nonlinearity. The response curve can help identify the range within which the sensor’s output remains linear and where deviations occur.
Threshold and Detection Limits
If the response curve exhibits a threshold region, it indicates the minimum input signal required to produce a detectable output from the sensor. The response curve can help determine the sensor’s detection limits, which are the minimum and maximum values of the input signal that can be reliably detected and measured by the sensor.
Saturation Behavior
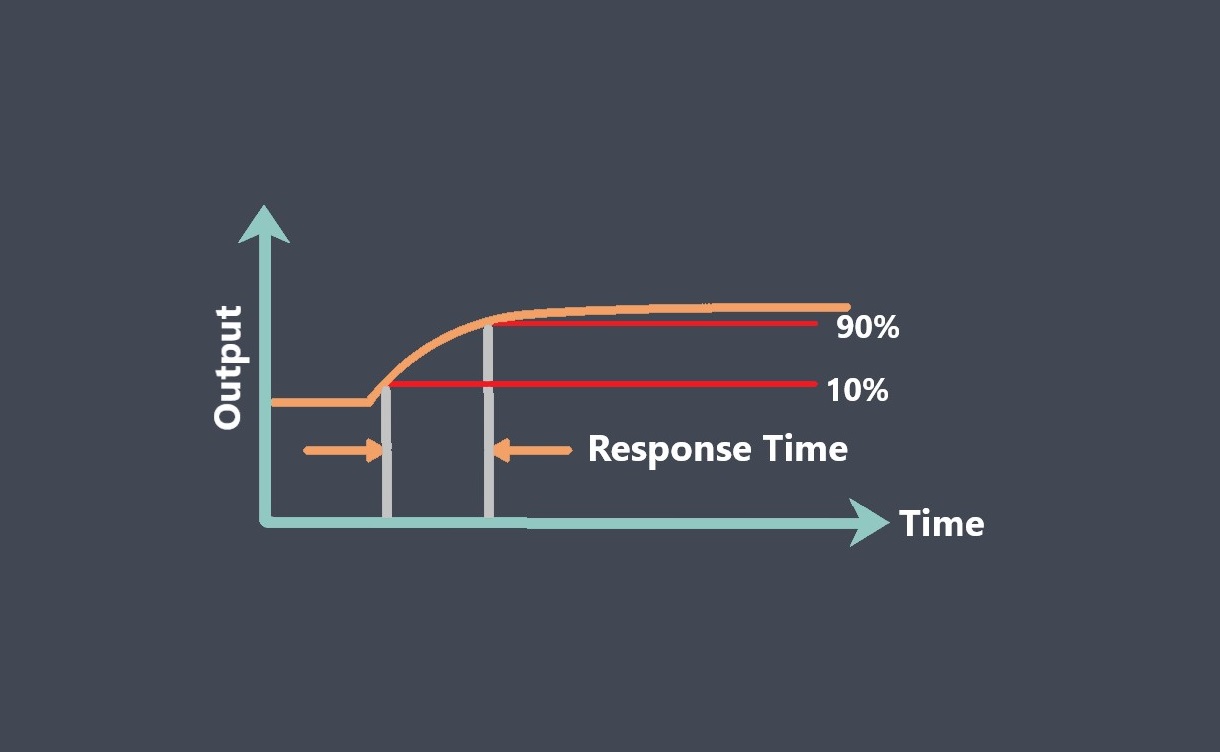
Saturation behavior can be observed from the response curve. Saturation occurs when the sensor’s output no longer increases proportionally to the input signal and reaches its maximum measurable value. The response curve can provide insights into the saturation behavior of the sensor, such as how quickly saturation is reached and how the output behaves in the saturated region.
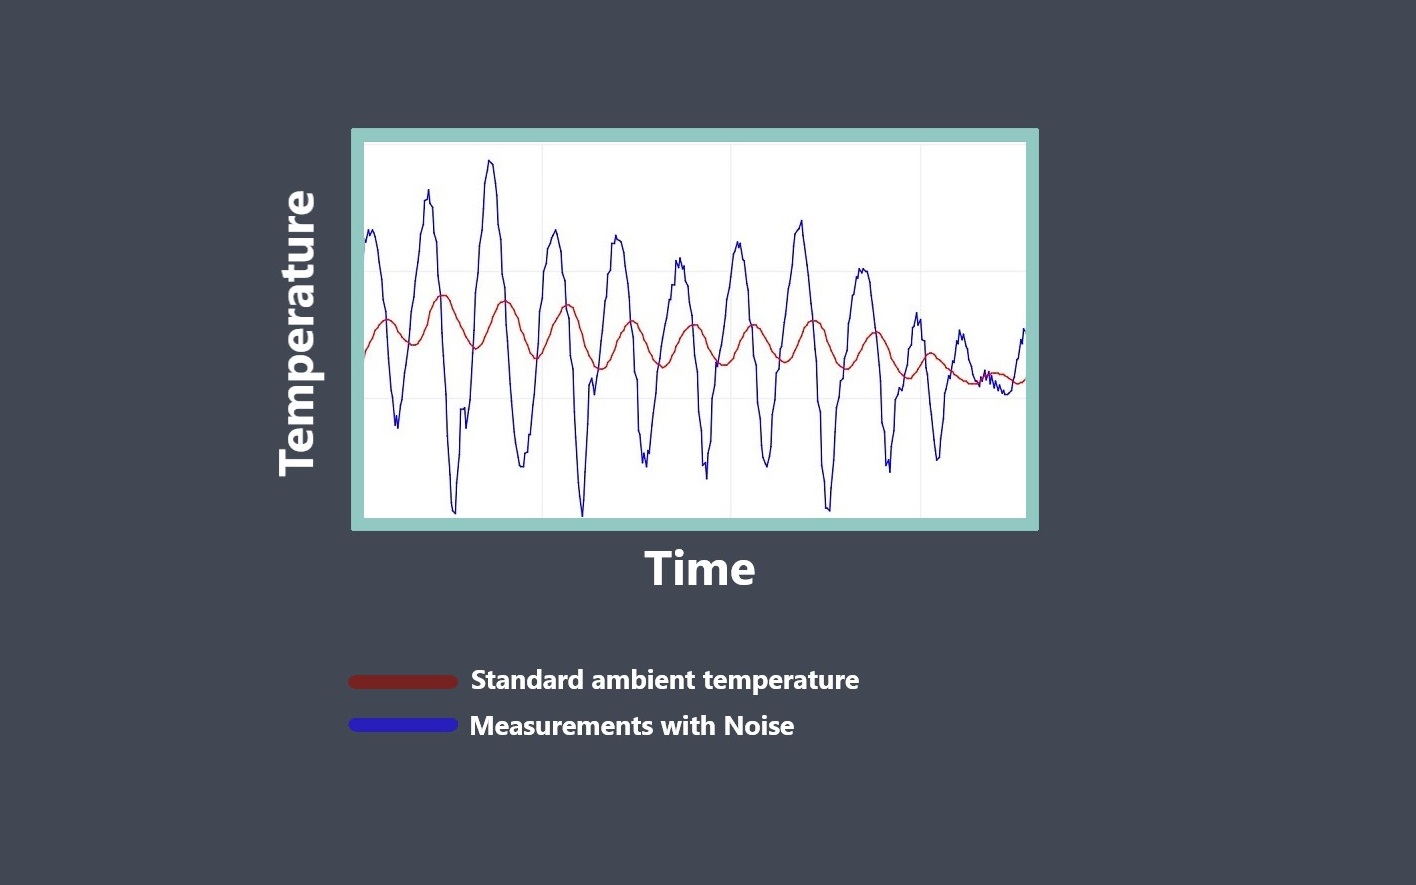
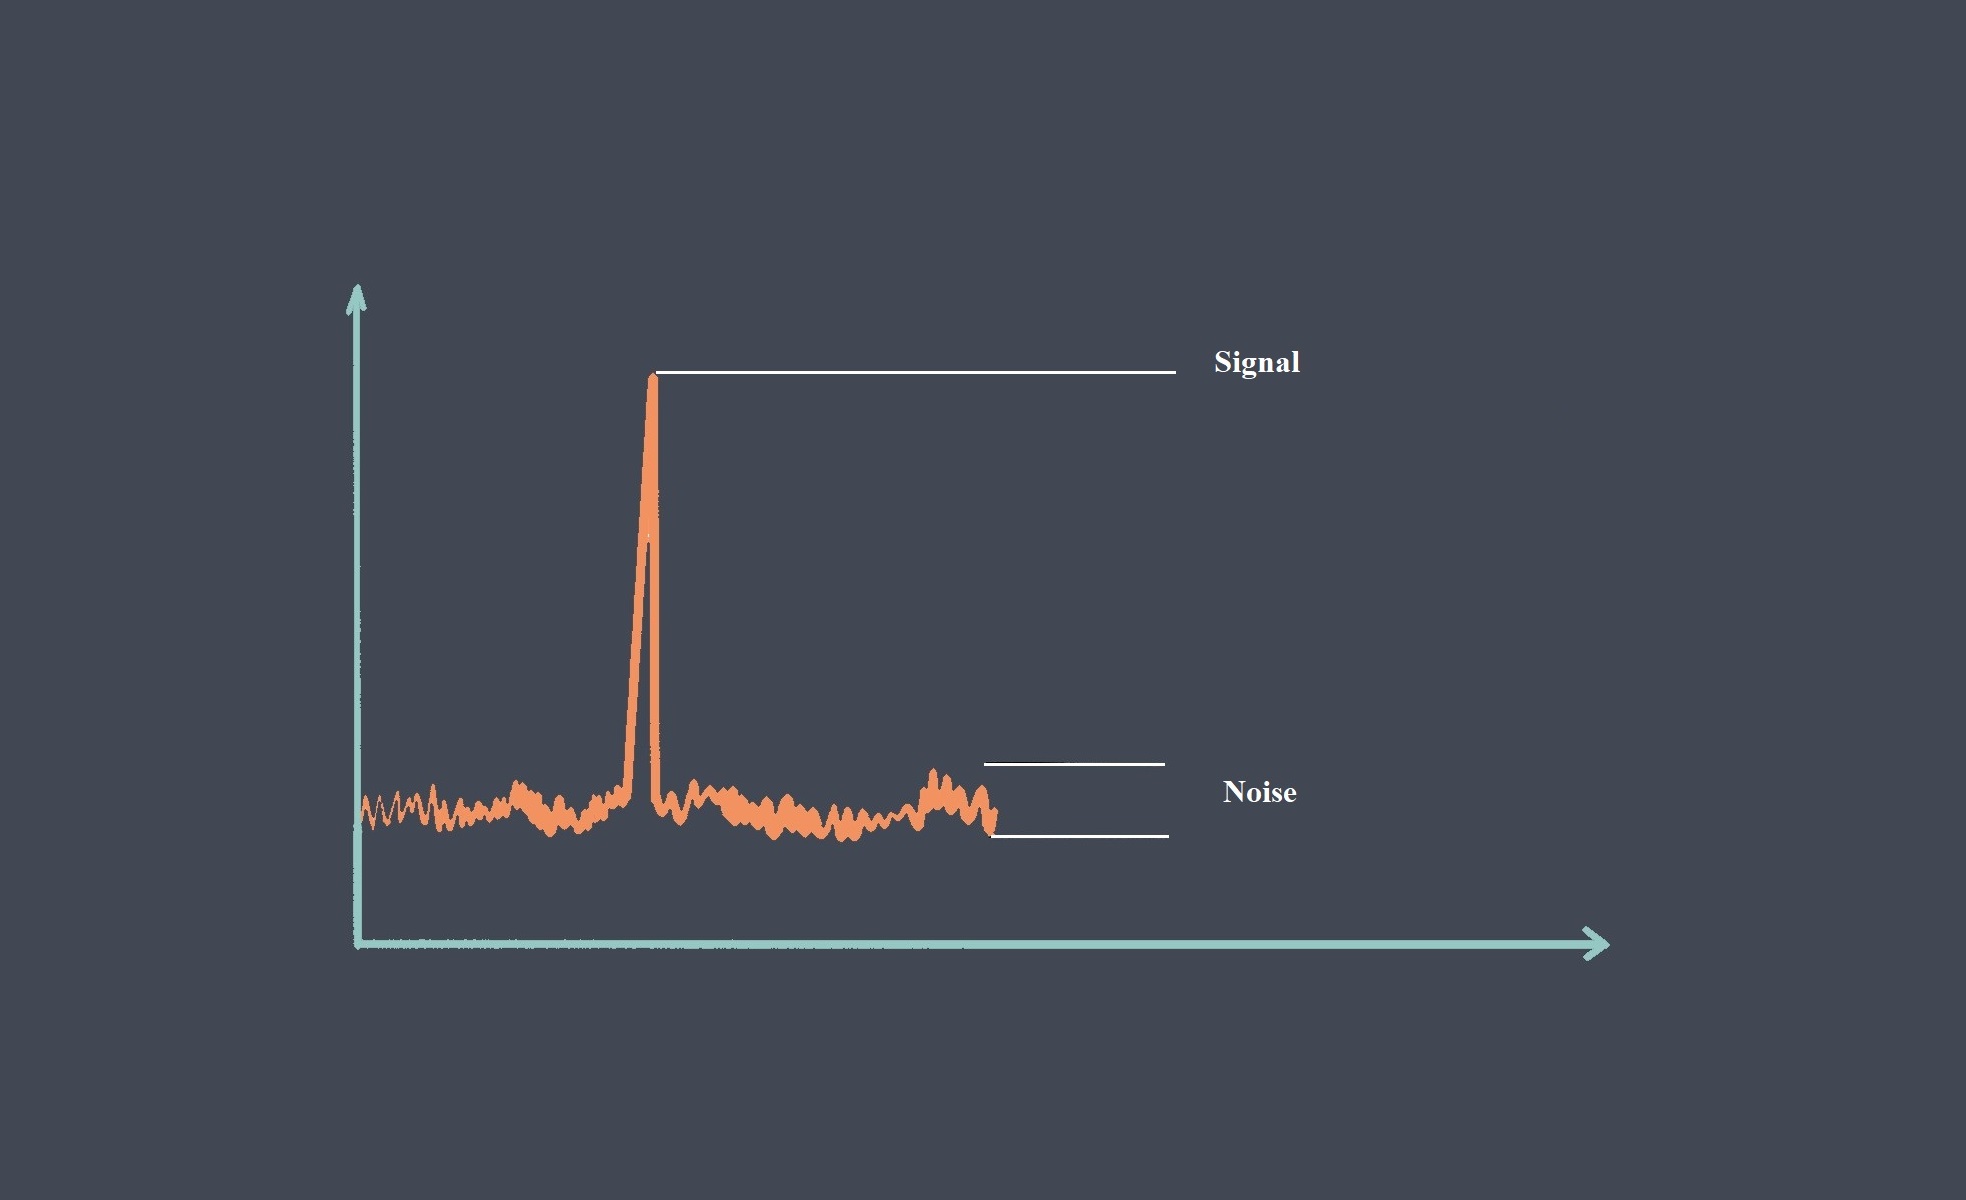
while the response curve provides valuable information about the characteristics of the sensor, other factors such as temperature effects, noise, hysteresis, and environmental conditions can also influence the performance of the sensor. Therefore, a comprehensive understanding of the sensor’s specifications and operating conditions is necessary for accurate interpretation and utilization of the response curve.

